Production cross-section limit
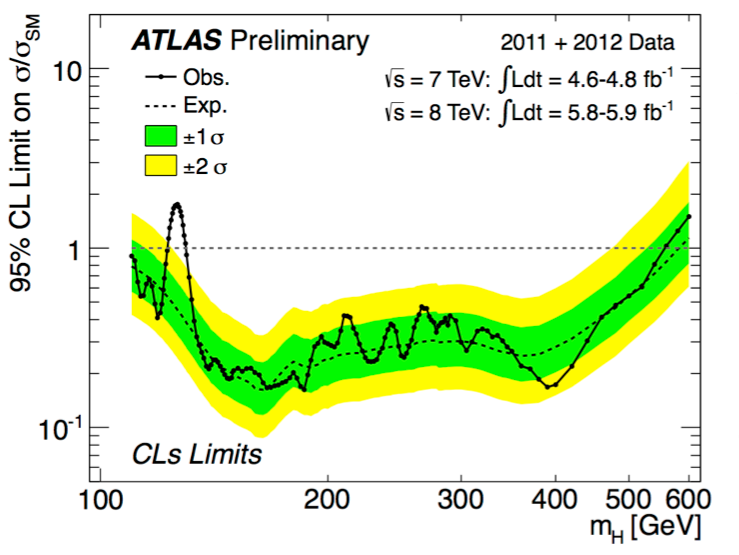
Figure 1: Result of the Standard Model Higgs search using all the data collected by the ATLAS detector at √s = 7 and 8 TeV up to the 18th of June 2012 corresponding to almost 11 fb-1. The black full line shows the observed limit on the production cross-section of a hypothesized Higgs particle with a mass of mH in units of the predicted Standard Model cross-section. A Standard model Higgs boson is excluded in the mass ranges where the observed limit lies below 1. The dashed line shows the expected limit in the absence of a Higgs signal. The green and yellow areas show the 1 and 2 standard deviation (σ) bands for the expected limit. In the region around 126 GeV the observed limit shows an excess of events with a 5σ local significance. A similar excess was observed by the CMS experiment in the same mass region.

A comparison of results from the diphoton and ZZ* to four leptons channels.
Figure 2: The reconstructed four-lepton mass distribution in the H → ZZ(*) → ll l'l' search based on all the data collected by the ATLAS detector at √s = 7 and 8 TeV up to the 18th of June 2012 corresponding to 10.6 fb-1. The black dots show the distribution observed in ATLAS data. The red filled histogram shows the expected contribution from Standard Model processes other than Higgs production (called background processes). The expected distributions for different Higgs mass hypotheses are shown by full blue (mH = 125 GeV), orange (mH = 150 GeV) and magenta (mH = 190 GeV) histograms. The excess of events around m4l = 125 GeV contributes to the deviation seen on Figure 1 around the mass hypothesis of mH = 125 GeV.


Last modified: 2012/07/04